DataSquish
Process your data, at the click of a button.
Get the most out of your data using our intuitive tools to process and visualize your data in minutes.
Powerful features to boost your productivity

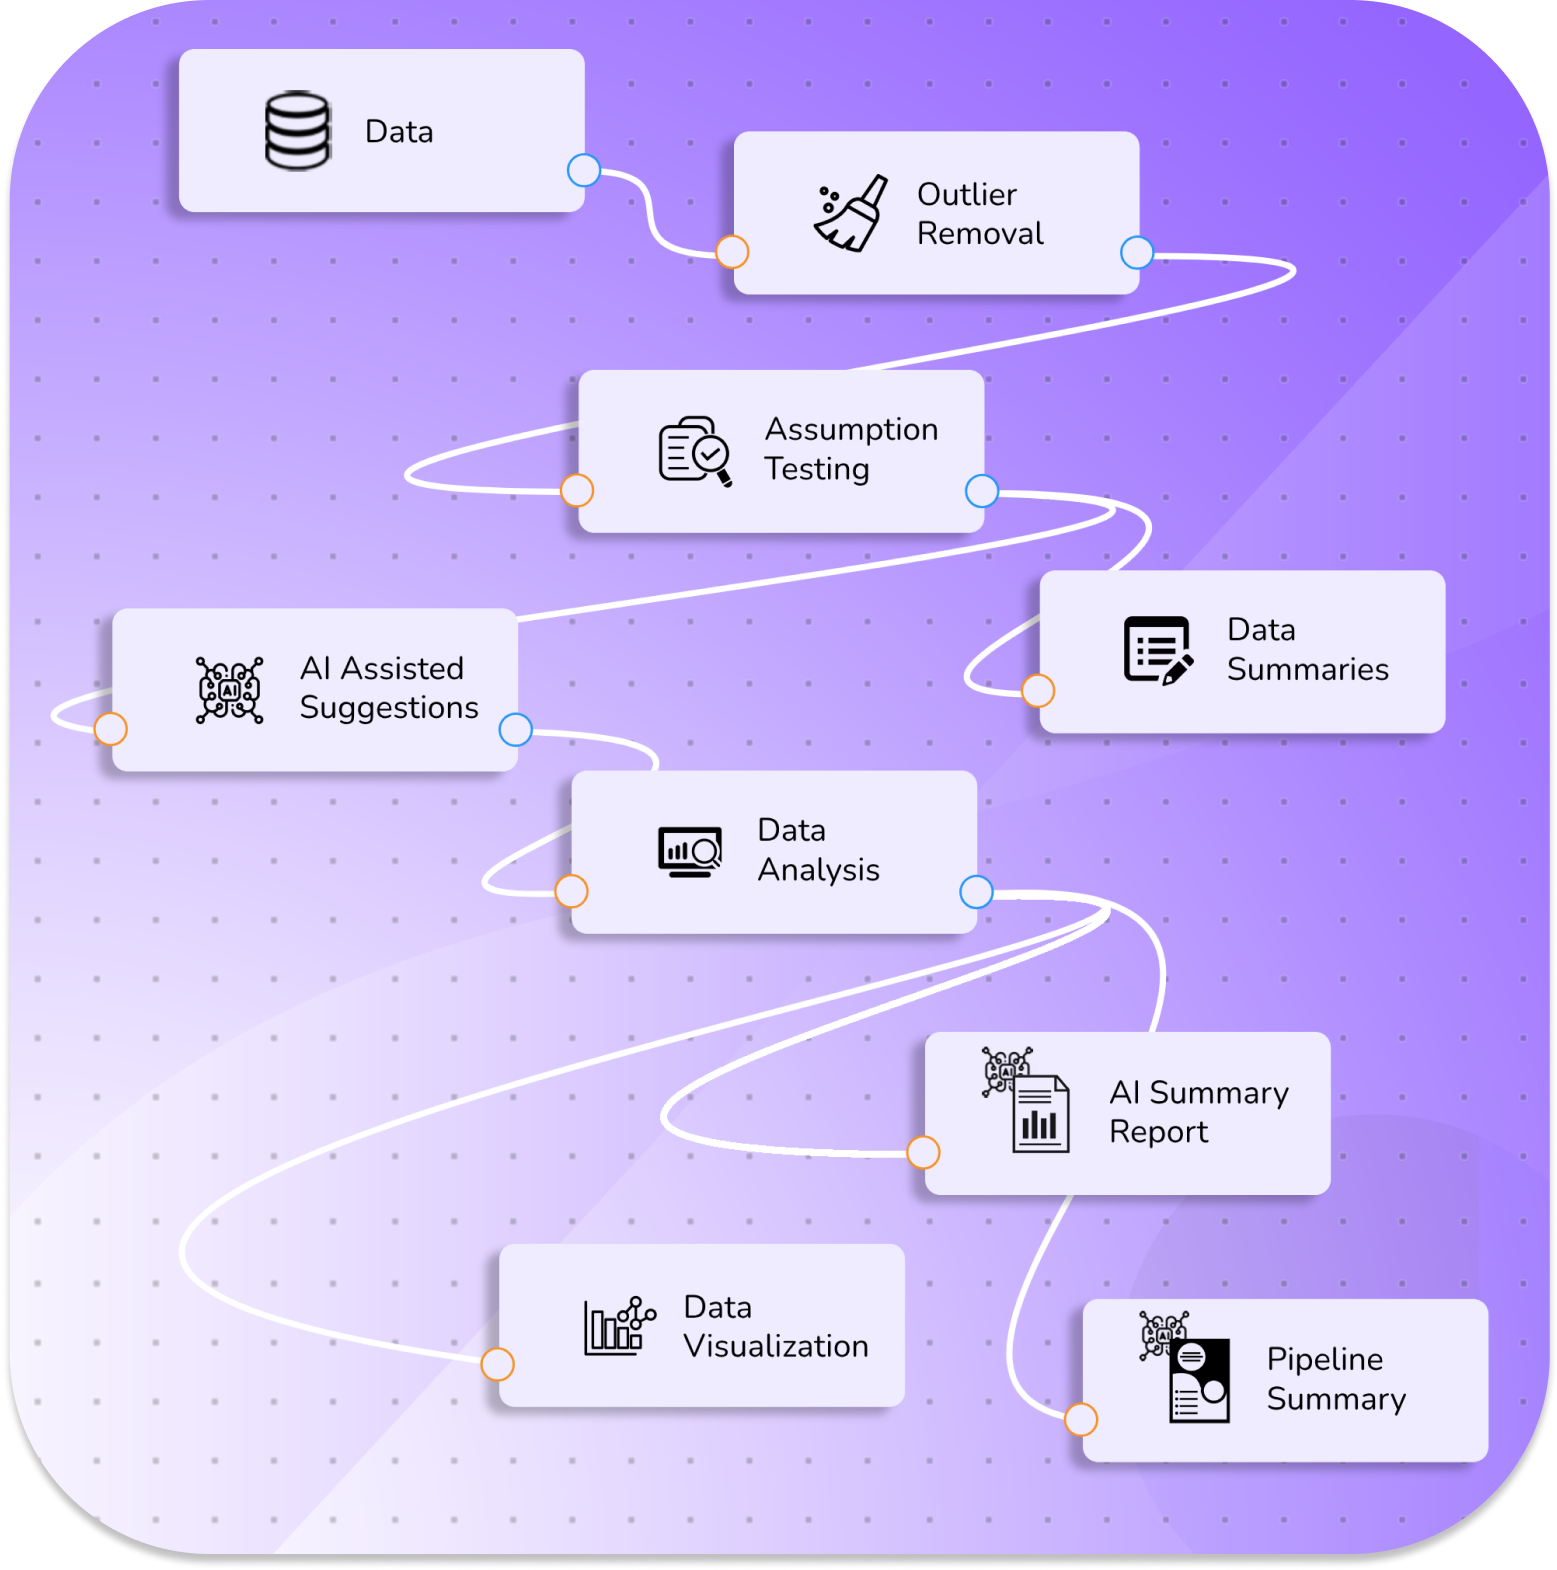
Nodes in our editor are the building blocks of your data analysis, each representing a unique operation. They connect to form a visual 'map' of your research process, simplifying navigation and understanding.

Automated Summaries
Our AI guides you through advanced statistical tools, highlights key data insights, and generates concise summaries of your methods and results. This ensures critical findings are never missed and facilitates quick interpretation and dissemination of results.

Transform your data into custom, easy-to-understand graphics. Our advanced visualization tools allow you to present your research findings clearly and effectively.
What are nodes?
Nodes are the fundamental units of our editor. Each node represents a unique data operation, such as filtering data, calculating a statistic, or applying a model.
Customizable to your needs
The node-based editor is highly customizable. You can create complex data operations by combining multiple nodes, allowing you to tailor the editor to your specific research needs.

AI-Guided Analytics
Our AI acts as your personal research assistant, guiding you through the use of advanced statistical tools. It helps you navigate complex data analysis tasks and highlights key insights in your data, ensuring you never miss important findings.
Automated Summaries
The AI also generates concise, easy-to-understand summaries of your data analysis pipeline. These summaries can be used to communicate your research process to others, or to help you remember your research process at a later date.

Custom Graphics
Our tools allow you to create custom graphics that accurately represent your data. You can choose from a variety of chart types and customize them to fit your research needs.
Easy-to-Understand Visuals
The graphics you create with our tools are designed to be easy to understand. They present your data in a clear and concise way, making it easier for you and others to interpret your research findings.
Adaptable to Research Formats
Our visualization tools are adaptable to common research formats. Whether you're preparing a research paper, a presentation, or a report, you can create graphics that fit your format requirements.
Creative Freedom
Beyond conforming to research formats, our tools also give you the freedom to create your own unique visuals. You can experiment with different chart types, colors, and layouts to create graphics that truly represent your research.

Designed by researchers for researchers.
Driven by a deep passion for data and innovation, we are dedicated to streamlining processes and accelerating progress. Our node-based statistical editor stands as a testament to this commitment, enabling easier and more effective data analysis.
Beyond a mere tool, we're fostering a community of like-minded individuals, researchers and data enthusiasts — united by a shared belief in the transformative potential of data, the significance of efficiency, and the rapid strides of continuous learning.
Embark on this thrilling voyage with us to reshape the landscape of research.
 Hassan Farhat
Co-Founder & CTO
Simple and flexible pricing
Starter
$14.99/ month
Ideal for individuals
Access to Node-Based Editor
AI-Guided Analytics
Basic Visualization Tools
Support for up to 3 Projects
Standard Email Support
Professional
$24.99/ month
Perfect for faculty and small teams at universities.
All Starter features
Automated Summary Generator
Advanced Visualization Tools
Support for up to 10 Projects
Faster Priority Email Support
Premium
$49.99/ month
Designed for larger teams and departments.
All Professional features
Collaborative Features for Teams
Support for Unlimited Projects
Enterprise
Custom Pricing
Tailored solutions for large organizations universities, and corporations.
All Premium features
Dedicated Account Manager
Customized Training and Onboarding
Priority 24/7 Support
API Access for Integrations
Custom Support for Unlimited Projects
Student Discount
If you're a student, you can get a heavy discount on our Starter, Professional, and Premium plans. Proof of enrollment required.
Early Adopter Discount
Register you interest now and get a 20% discount. This offer is available for a limited time only, so don't miss out on this opportunity to revolutionize your research process at a discounted rate.
Sign Up Now!
Join us as an early adopter and shape the future of research tools. Register your interest now to be among the first to experience our revolutionary node-based statistical editor and have a unique opportunity to influence its design.
Be a part of the research revolution.

Copyright © Datasage | Some artwork provided by Flaticon | Design provided by VictorFlow